Pushing APEX Collections to the Limit

Introduction
I talked with two APEX experts at KSCOPE23 regarding the use of APEX Collections. We all agreed that APEX Collections should be used cautiously and that performance issues were likely if you overused collections, especially in a large-scale APEX environment.
When I got back from KSCOPE23, I decided to perform some empirical testing to find out at what point performance starts to degrade when using collections.
Test Environment
I ran my tests on an Oracle OCI Base Database:
Shape: VM.Standard.E4.Flex
CPU core count: 1
Memory: 16GB
DB Version: 19.19.0.0.0
Theoretical max IOPS: 15.36K
There was nothing else going on in the instance when I ran these tests.
Methodology
Generating Collections
I have a table of EV sales by year in California. The table has 15,591 rows. I used the following script to create 200 collections in 200 different APEX sessions, each collection containing 15,591 rows.
DECLARE
  l_query  CONSTANT VARCHAR2(4000) := 'SELECT data_year, county, fuel_type, make, model, number_of_vehicles FROM ev_sales_by_year';
BEGIN
  FOR i IN 1..200 LOOP
    apex_session.create_session (p_app_id => 201, p_page_id => 1, p_username => 'COLLECTION_PERFORMANCE');
    apex_collection.create_collection_from_query_b
     (p_collection_name => 'COLLECTION_PERFORMANCE',
      p_query           => l_query);
    apex_session.detach;
  END LOOP;
END;
Counting Collection Members
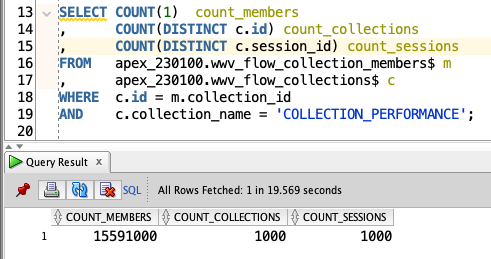
After each execution of the above script, I ran the following SQL as the SYSTEM user. This gave me a total count of collections, sessions, and collection members across all APEX Sessions in the database instance.
SELECT COUNT(1)  count_members
,      COUNT(DISTINCT c.id) count_collections
,      COUNT(DISTINCT c.session_id) count_sessions
FROM   apex_230100.wwv_flow_collection_members$ m
,      apex_230100.wwv_flow_collections$ c
WHERE  c.id = m.collection_id
AND    c.collection_name = 'COLLECTION_PERFORMANCE';
Assessing the Impact
Finally, I created a simple APEX Page, which creates a collection before each page view. To avoid confusion, the collection has a different name APEX_PAGE from the one in the previous section, COLLECTION_PERFORMANCE. The APEX_PAGE Collection contains 15,591 records.
I used abex_debug.error to get a timing for the collection generation for each page view. This avoided enabling debug to get the timing (which incurs an overhead).
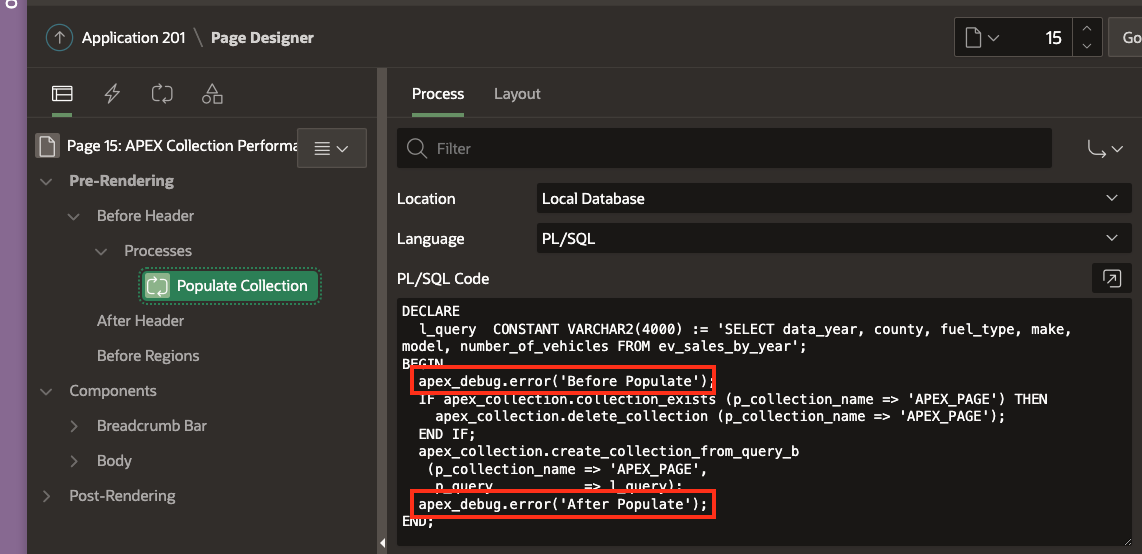
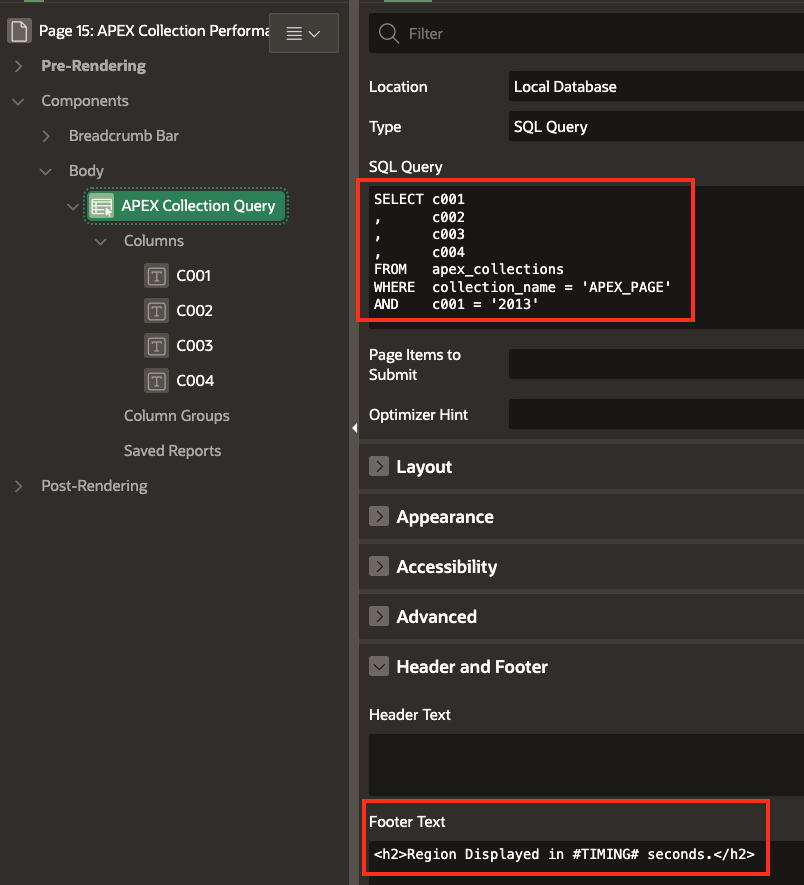
The page also contains a simple Interactive Report on the collection APEX_PAGE and includes a #TIMING# substitution string in the Footer Text. The #TIMING# substitution string displays the number of seconds it takes APEX to run the report on 15,591 rows.
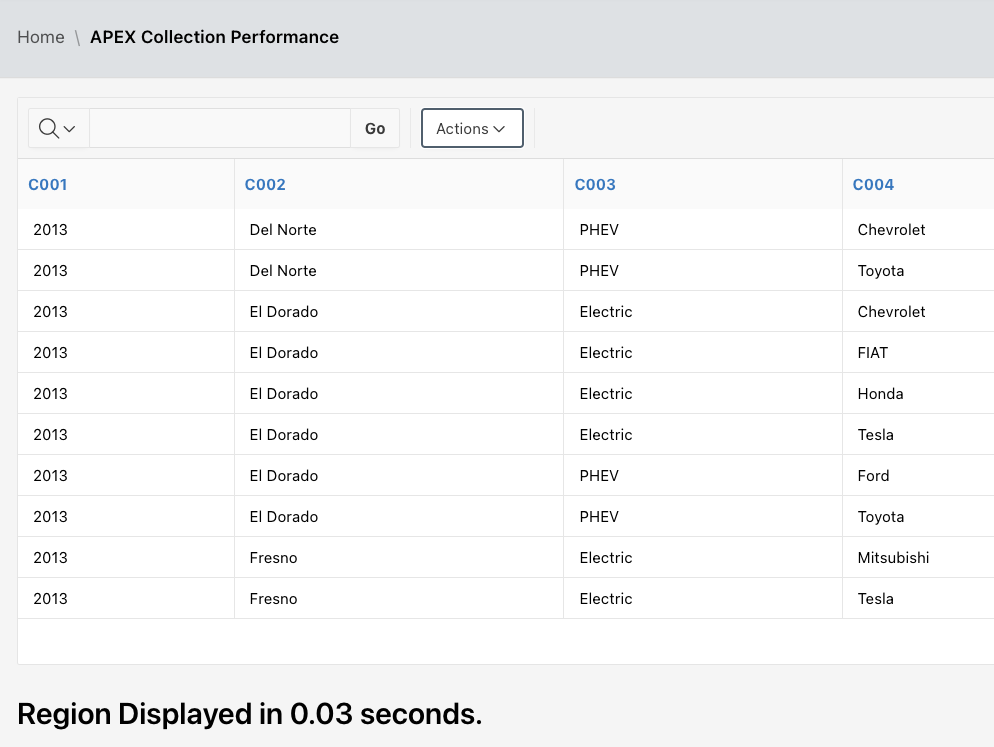
The report output looks like this:
The SQL APEX Runs
At this point, it is worth noting that APEX wraps any SQL statement provided in a report region to get the total row count and limit the number of records returned. After checking APEX Debug, I could see the SQL being run by APEX for this report was as follows:
select i.*, count(*) over () as APEX$TOTAL_ROW_COUNT
 from (select "C001","C002","C003","C004"
from(select /*+ qb_name(apex$inner) */d."C001",d."C002",d."C003",d."C004" from(SELECT c001
,      c002
,      c003
,      c004
FROM   apex_collections
WHERE  collection_name = 'APEX_PAGE'
AND    c001 = '2013'
)d
 )i
)i where 1=1  and rownum<=1000001
Results
I took initial timings with no collection records at all. I then generated five sets of 200 collections in 200 different APEX Sessions. The results are as follows:
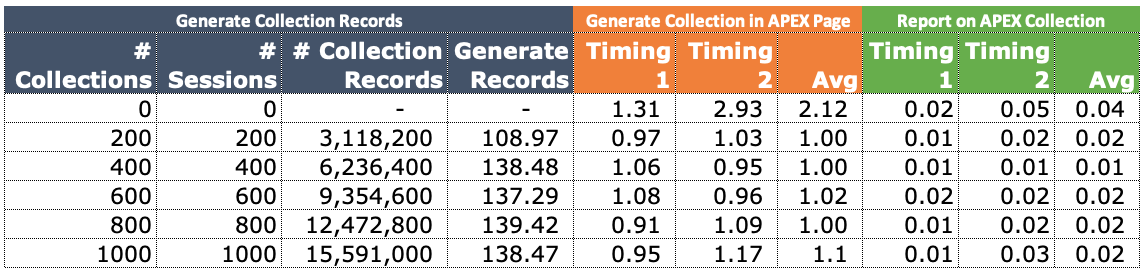
- Columns in Grey represent the generation of 15.5 million records in the 'COLLECTION_PERFORMANCE' collection across 1,000 APEX sessions.
Columns in Orange represent the timings to generate records in the collection called
APEX_PAGEin the APEX Page Process.Columns in Green represent the timings to run the Interactive report on 15,591 records in the collection called
APEX_PAGE.
I took the screenshot below to prove that over 1,000 APEX Sessions were generated from these tests.
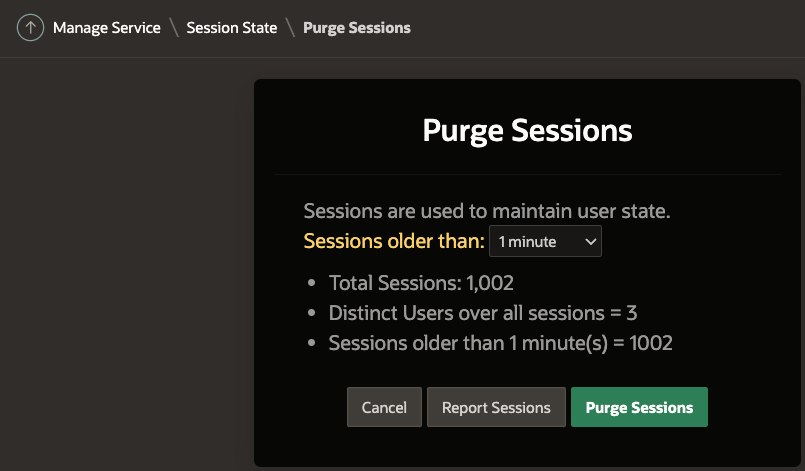
and more than 15.5 million collection records:
Considerations
I did not test the impact of contention on the collections table. I am sure performance will be negatively impacted if hundreds of sessions are constantly adding/deleting records.
I cleared down the 15 million collection records by running the following script.
DECLARE
  CURSOR cr_sessions IS
    SELECT apex_session_id
    FROM   apex_workspace_sessions
    WHERE  user_name = 'COLLECTION_PERFORMANCE';
BEGIN
  FOR r_session IN cr_sessions LOOP
    apex_session.attach (p_app_id => 201, p_page_id => 1, p_session_id => r_session.apex_session_id);
      IF apex_collection.collection_exists (p_collection_name => 'COLLECTION_PERFORMANCE') THEN
        apex_collection.truncate_collection (p_collection_name => 'COLLECTION_PERFORMANCE');
      END IF;
    apex_session.detach;
  END LOOP;
END;
This script took 744 seconds (12.4 minutes) to complete. This gives you an idea of the impact of deleting records from collections when many records are in the collection table.
Conclusion
I must say that I was pretty surprised by the results. The final test showed almost no performance degradation with more than 15 million collection records.